
X-ray fluorescence
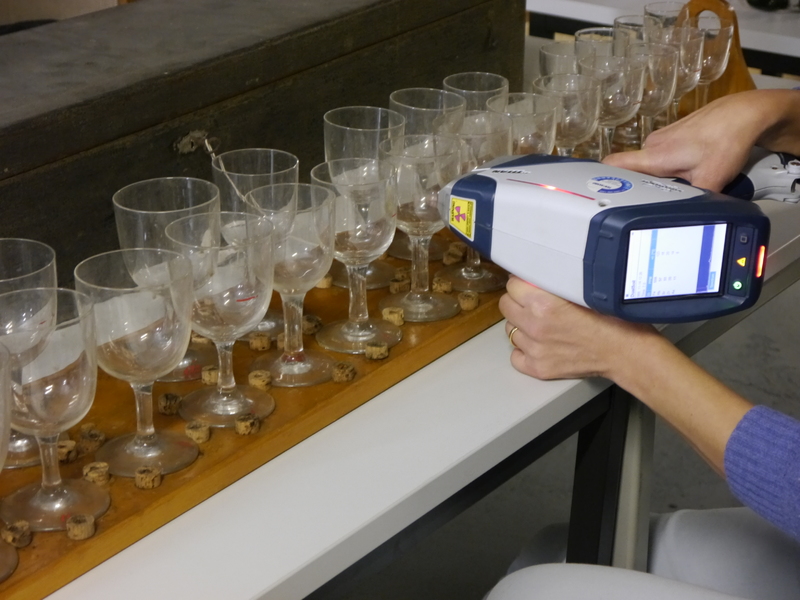
In-situ analysis with the handheld XRF spectrometer on a verrophone (Inv. No. 2003-27T1). (Attribution) Photo: Deutsches Museum, C. Holzer CC BY-SA 4.0
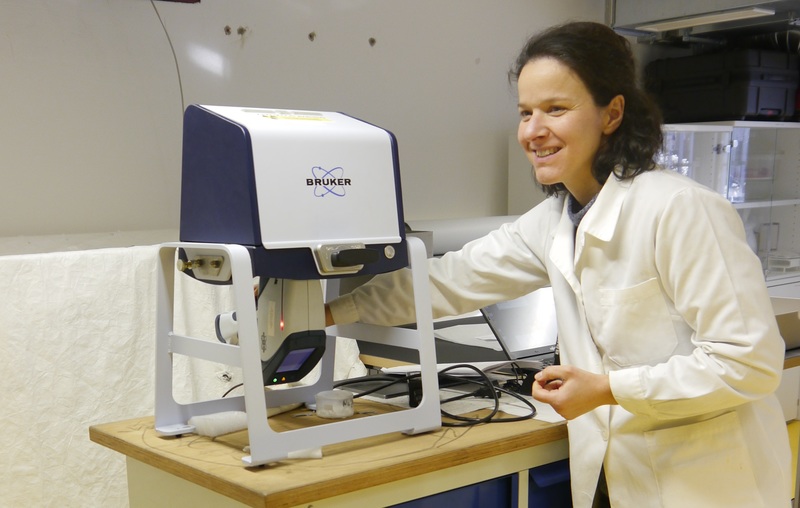
Dr. Marisa Pamplona doing an analysis with the handheld XRF spectrometer on the separate glass plates placed in the radiation-protection chamber (Inv. No. 45933). (Attribution) Photo: Deutsches Museum, C. Holzer CC BY-SA 4.0
The analysis with a hand-held XRF device is a relatively inexpensive method to gain information on the elemental composition of a material. With a minimum amount of sample preparation (e.g. removing corrosion layers or dust) results are obtained quickly. Long-wave x-rays (10.00–0.01 nm) interact with the surface elements, removing electrons from the inner shells once their binding energy is overcome. Electrons from outer shells fill the voids to stabilize the atom and thereby set free an amount of energy, that is characteristic for each element. The final identification is done by a software-based interpretation of the resulting spectra: to confirm the presence of an element, both the location of the lines (energy) and the ratio of their intensities have to match.
This method is a surface analysis and does not necessarily reflect the composition of the bulk glass. A relevant limitation of the handheld-XRF method is that boron, sodium and magnesium – three typical glass components – cannot be detected due to their low elemental weight. Furthermore, it is not possible to clearly distinguish between the glass network formers arsenic and lead because both elements release fluorescent x-rays with similar energy. This results in overlapping lines in the spectrum at 10.54 keV for arsenic and 10.55 keV for lead (Kaiser/Shugar 2012). It is possible to differentiate between them by checking the other specific fluorescence lines of the respective elements. Also, the ratio of the intensities, represented by the height of the lines, are characteristic for each element. However, since this is not a quantitative study (no comparison with glass standards), both arsenic and lead were listed, indicating that the presence of both elements is possible.
The analysis was conducted in-situ on several points on the glass instruments in ambient conditions, using Bruker Titan S1 600-800 handheld XRF spectrometer (Si-PIN detector, Source: Rh source). A preset analytical mode “Soil Calibration P/N 730.0083” was applied, which structured the measurement in two phases for heavy (Voltage: 45 kV, Current: 12 µA,TiAl filter, Acquisition Time 30s) and light elements (Voltage: 15 kV, Current: 29 µA, Acquisition Time 30s). No glass standards with known compositions were used to calibrate the device by way of comparative measurements and therefore this study presents a qualitative data analysis. After a visual comparison of the spectra resulting from different measurement points, one could be chosen for the interpretation with the Bruker Artax Spectra software, to see if the results were in agreement.
Citation: Charlotte Holzer, ‘Findings from Non-destructive Material Analysis on Musical Glass Instruments’, in: Materiality of Musical Instruments. A Virtual Exhibition.